New and Old News
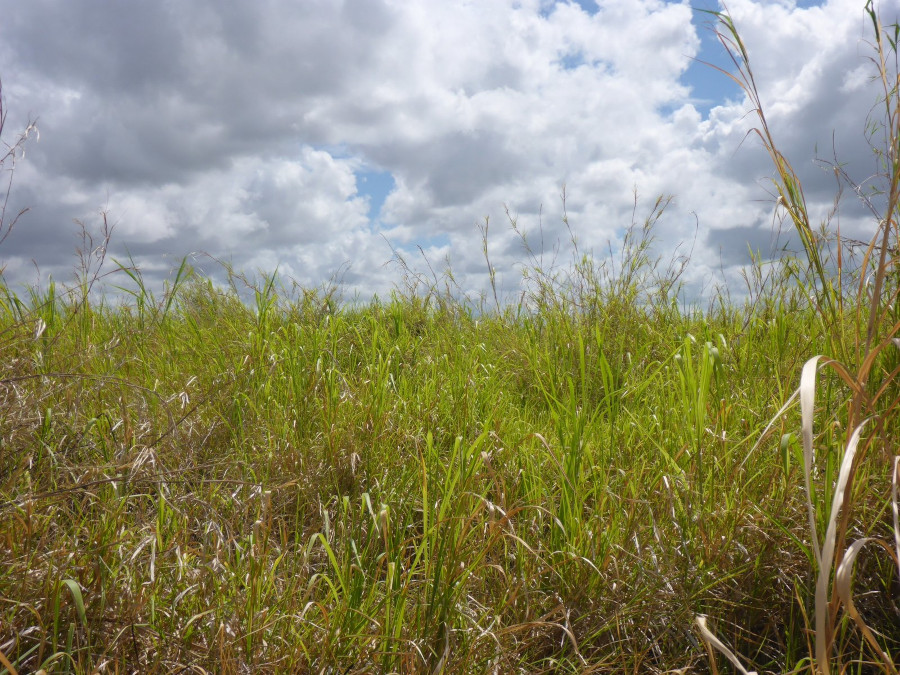
Vegetation of East African wetlands - Assessment using R and vegtable
Example session of the work with vegetation-plot observations in R using the package vegtable and a open accessible data set of more than 300 observations collected from published references and field surveys. This tutorial explains how to use the package vegtable to process data before starting statistical assessments. An additional task handled in this document is the use of taxonomic information and further species' attributes (traits) for calculating statistics at the plot level.

Syntaxonomic Classification of Chilean Vegetation
In a work published in the journal "Vegetation Classification and Survey", we did a comparison between associations according to the Braun-Blanquet approach and plant formations according to the EcoVeg approach. This classification was done on the basis of plots stored in the database "sudamerica". Here is the interactive flow diagram.
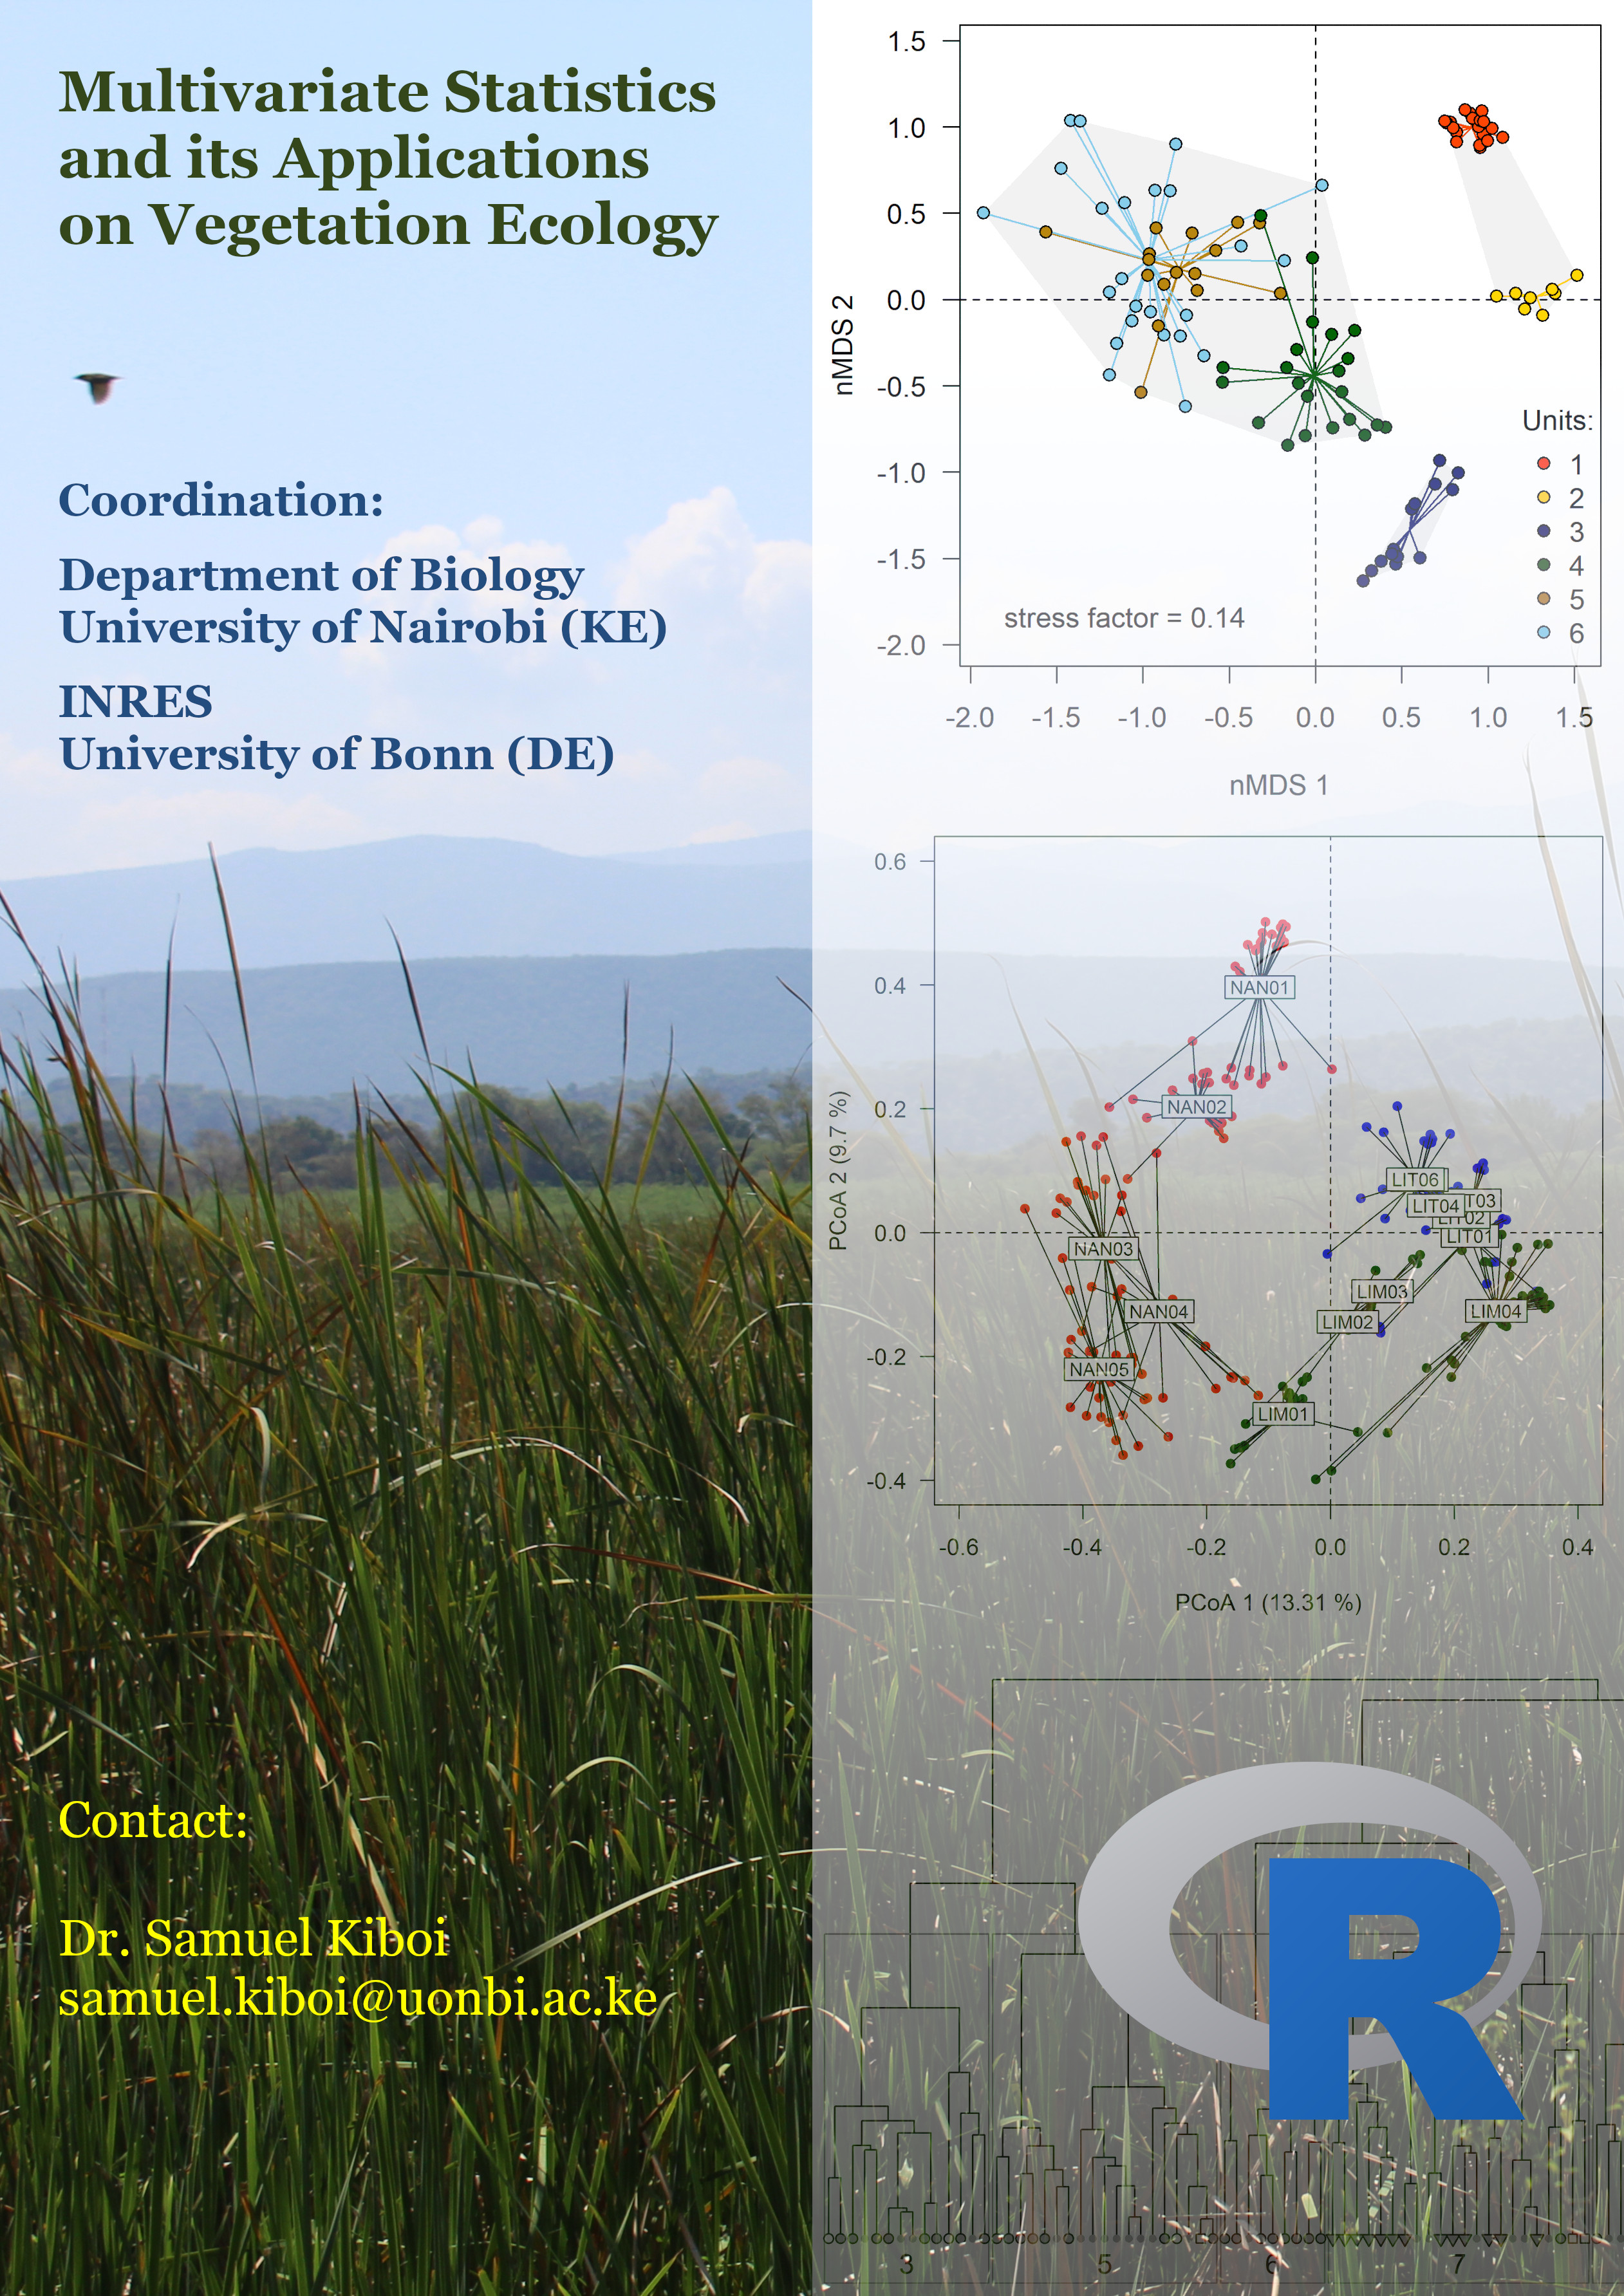
Course on Multivariate Statistics an R
A course on the applications of multivariate statistics on vegetation ecology is scheduled for the period between the 16th and 23rd of November in Nairobi.
Basics on the work with vegetation-plots in vegtable
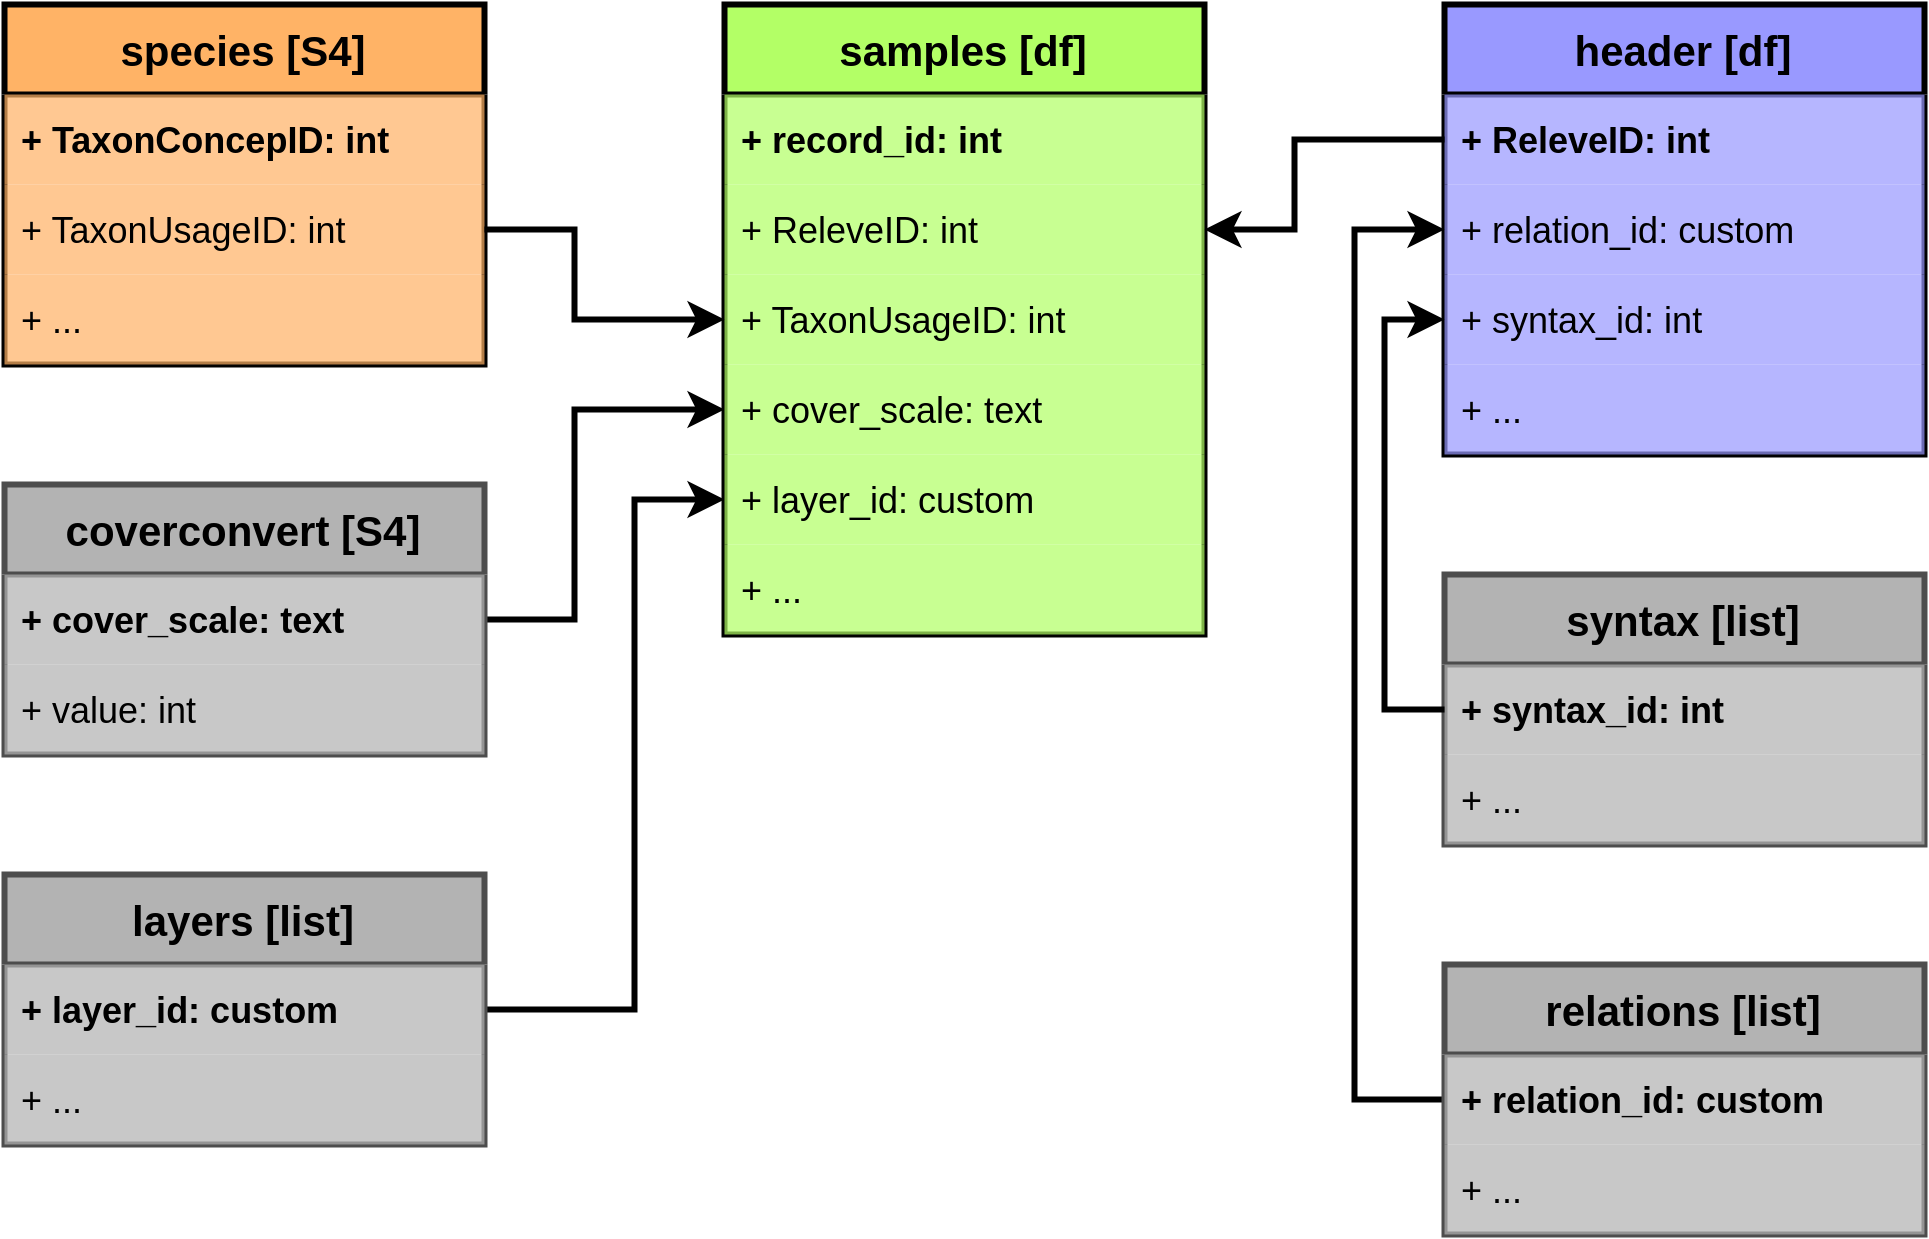
The package vegtable was developed for the handling of data provided by vegetation-plot databases in single objects within R sessions. In this package functions attempt to encapsulate process of complex data sets in brief command-lines during an R session and target to repeatability in the assessment of floristic information. Here we review through some examples the use of the most important functions implemented in vegtable.
Introduction to the package vegtable
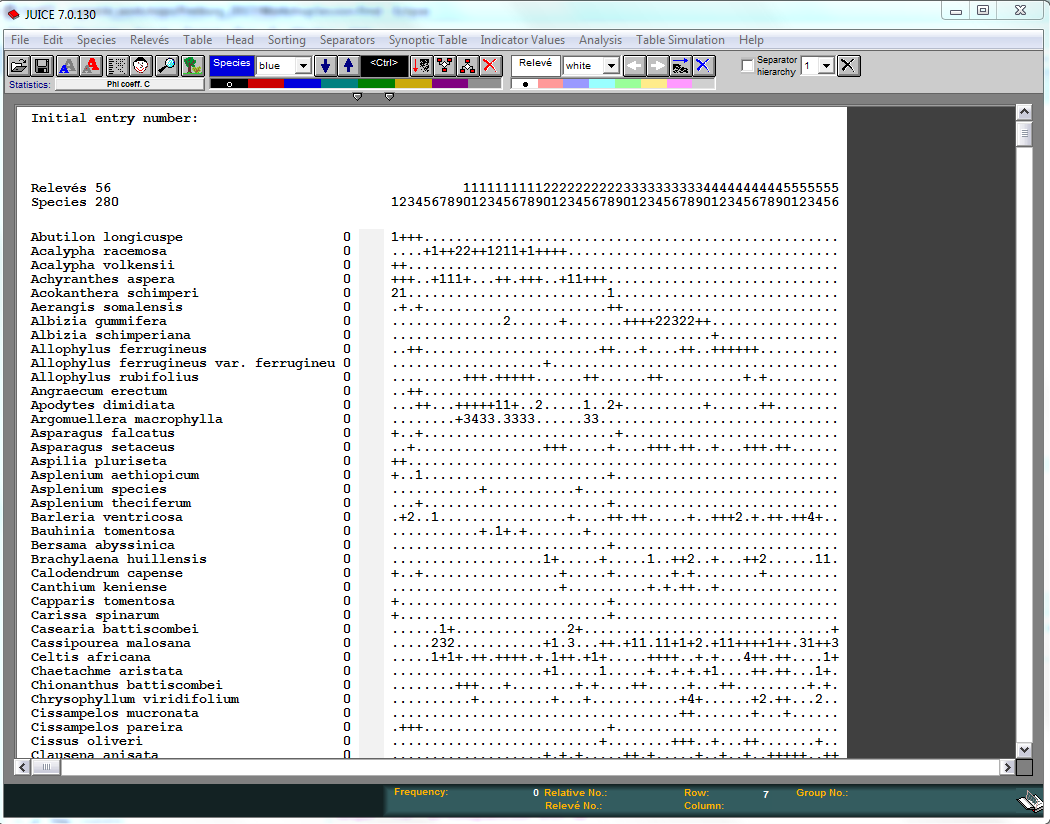
The package vegtable offers objects and functions for the work with plot observations in vegetation assessments (phytosociological relevés). This object class ensures consistency on data, while it is also allowing flexibility in the degree of completeness and resolution of data. This tutorial is an updated version of a workshop offered in the context of the 16th Workshop of the German Group on Vegetation Databases celebrated in Freiburg in March 2017.
vegtable: An R object for vegetation-plot data sets
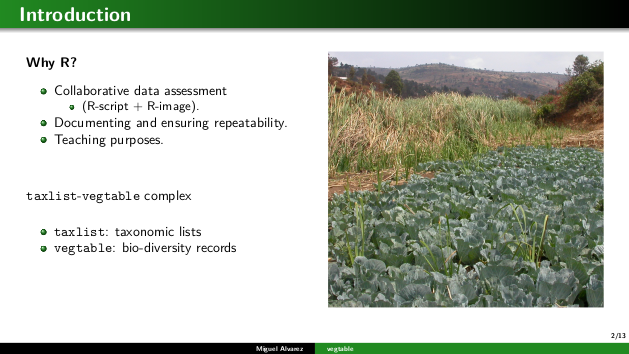
The package vegtable defines the homonymous object class and functions (methods) for handling vegetation-plot data sets in R. Within its slots, taxonomic lists are formatted as taxlist objects. This is a brief account about a presentation of vegtable and taxlist at the Marsaryk University in Brno (Czech Republic). The presentation includes a brief introduction to the structure of vegtable objects and functions.

sudamerica: A vegetation-plot database for the Neo-Tropics
A database initiated for relevés in temperate grasslands in Chile but currently open for all the American continent with a strong focus in South America. This database attempt to store published relevés for meta-analysis purposes.

SWEA-Dataveg: A vegetation-plot database for Africa
A collection of vegetation-plots from Africa, originally focused on wetland vegetation from Eastern Africa, it is currently expanded to other areas and considering any kind of vegetation.

A journey in rOpenSci
A brief account of the experiences gained after a bit more than 2 years review process of the package taxlist for its submission to rOpenSci. This journey resulted on new tools learned and new friends. The talk was presented at LatinR 2020 (virtual meeting).

R for AfRica
The proliferation of freeware and open source applications expands the potential of scientists, especially in countries of difficult access to commercial licenses for software tools. In the context of enhanced international networks between education and research institutions, training on use of freeware is becoming a crucial step for a better balance in collaboration between European and Eastern African countries, harmonizing the capacities among researchers and students.

Tanzanian wetlands in the cover of Phytocoenologia
A publication on classification of East African wetland communities in the context of the Braun-Blanquet approach managed to the cover of the journal Phytocoenologia.

Basics on the work with vegetation-plots in vegtable
The package vegtable was developed for the handling of data provided by vegetation-plot databases in single objects within R sessions. In this package functions attempt to encapsulate process of complex data sets in brief command-lines during an R session and target to repeatability in the assessment of floristic information. Here we review through some examples the use of the most important functions implemented in vegtable.